30 Day Map Challenge: Day 1
Maps
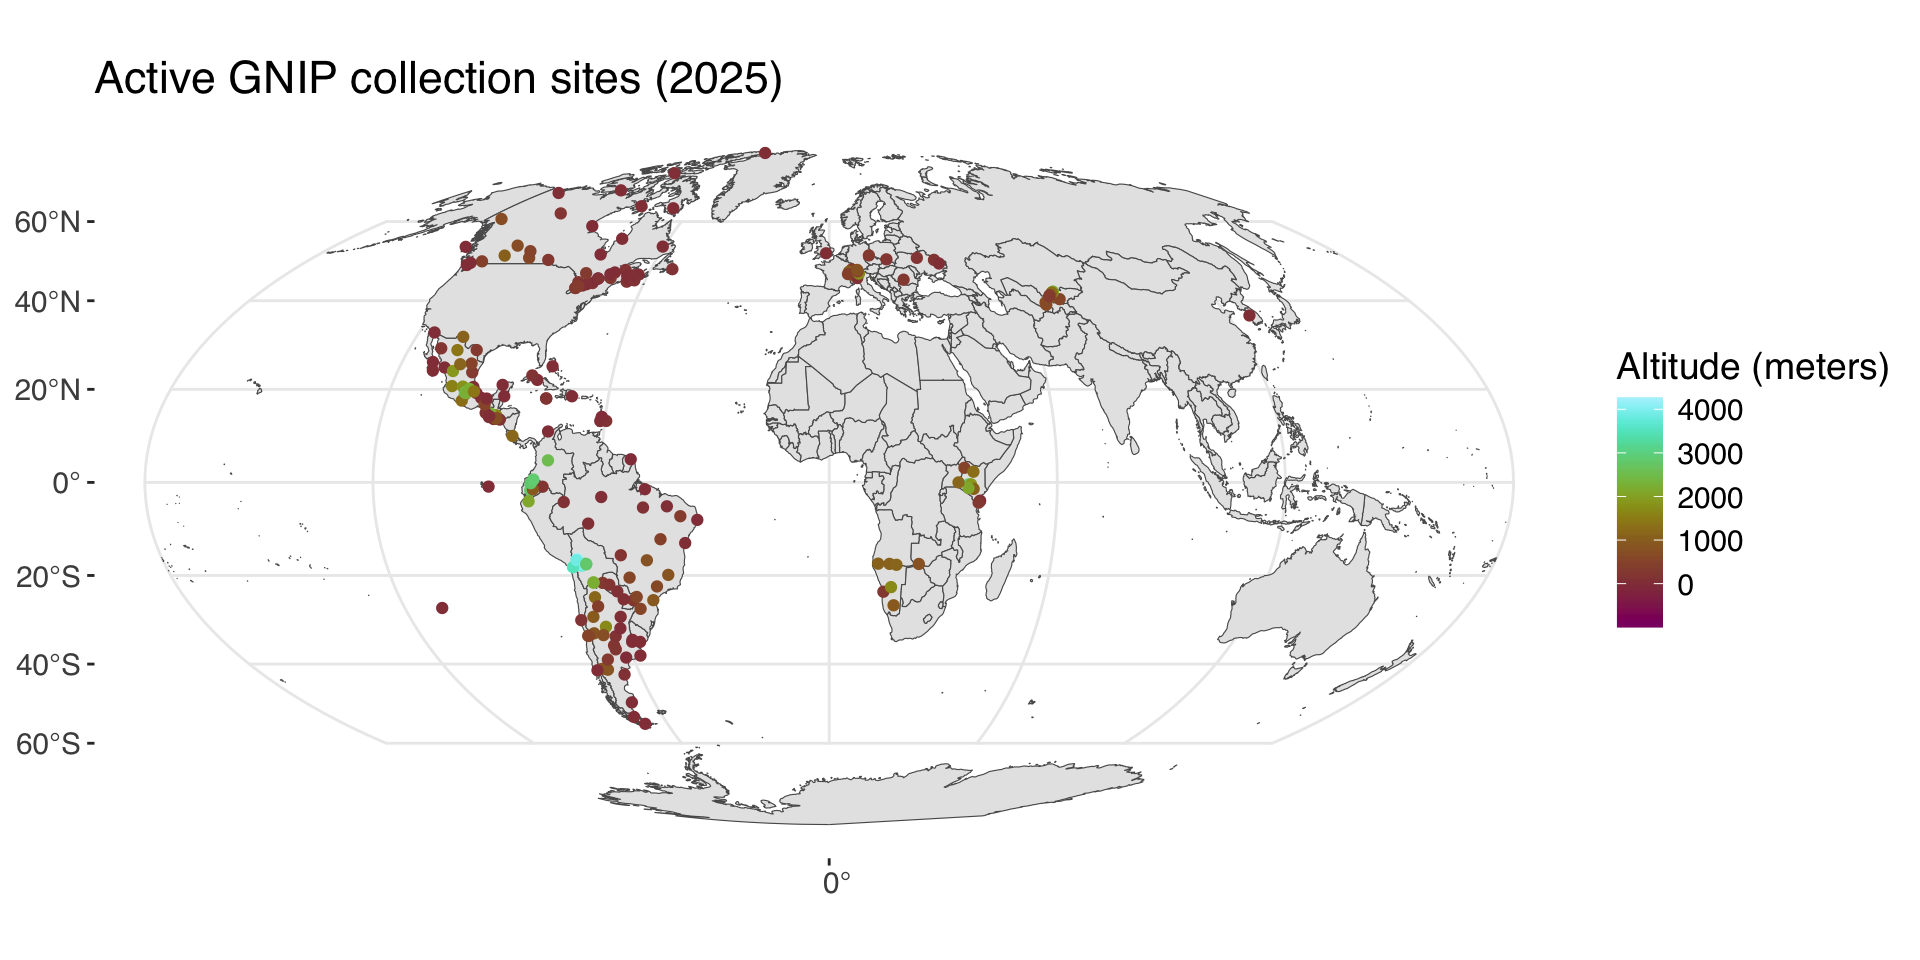
Site locations from GNIP
November #30DayMapChallenge
This month, I’ll post maps from the #30DayMapChallenge 2025 here on my little GitHub site.
Let’s see how far I get!
Day 1: Points
For the first map, I’m reminding myself how to plot spatial data in R. I’ve used QGIS to produce most of the maps I’ve made lately, so one aspect of this challenge for me will be deciding which tool to use for each map. This one is a good opportunity to revisit all the options in the sf package for R.
I downloaded data from the International Atomic Energy Agency’s (IAEA) Global Network of Isotopes In Precipitation (GNIP), which I’ll likely explore more of as the challenge continues. Today, I selected data from all active sites using IAEA’s database and plotted the collection station locations on a Mollweide Projection.
Canada and Central and South America have the most coverage. There is sparse coverage in Europe, and few active stations elsewhere in the world. Most stations are below 1000 meters above sea level. Good thing there are tools like the Online Isotopes in Precipitation Calculator to help fill in the wide gaps.